That old adage, “A picture is worth a thousand words” holds less credence than originally promised. A more accurate version might be “a visual representation is worth 8,547 words,” which doesn’t have quite the same ring. But, it turns out, visuals really do impact our brains in a way text alone doesn’t approach.
But you have data to share with customers. You need to explain how your products work and convey the importance of your services.
The solution is simple: pair the two together. Information meets image. The result is data visualization, also sometimes known as infographics, which break up the monotony of text. They spotlight your most intriguing and compelling selling points, answer questions, and distill complex ideas.
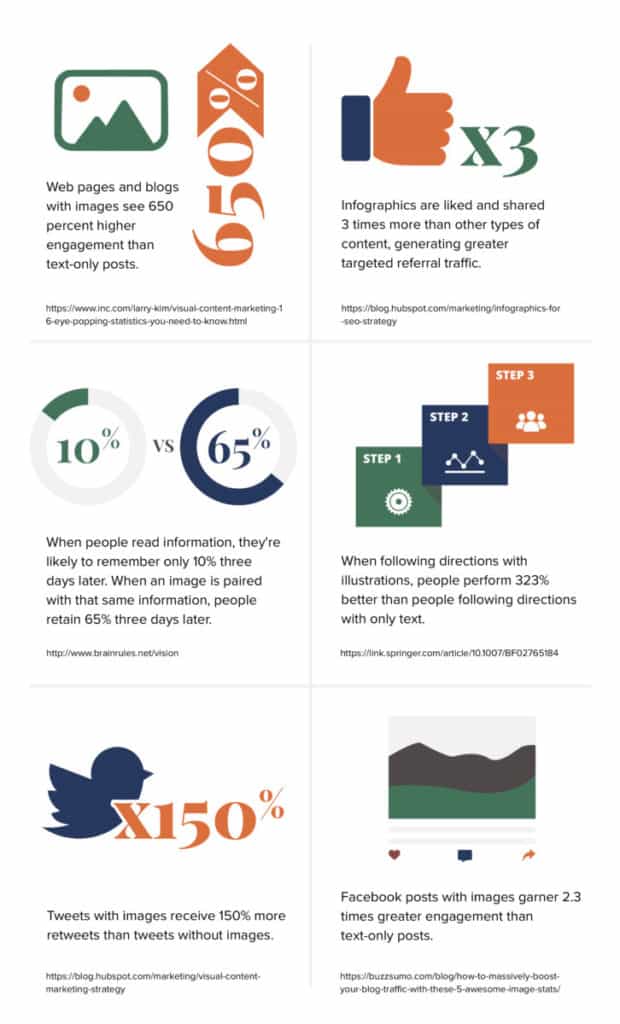
With just this handful of examples, it becomes pretty obvious that data visualization has the potential to have a major impact on multiple aspects of your business, far beyond strictly marketing. Data visualization isn’t just for selling. It can be used to visually demonstrate how products work, explain complex processes, illustrate financial reporting, and much more. When data is properly visualized, it has the potential to tell compelling stories that engage customers.
If you aren’t using visualization to its full potential, it’s time to change that. To learn how data visualization can make your pictures worth even more words, contact Red Mallard today. We’re here to help you bring your data storytelling to life.
